Navigating the San Francisco micro-mobilty wars

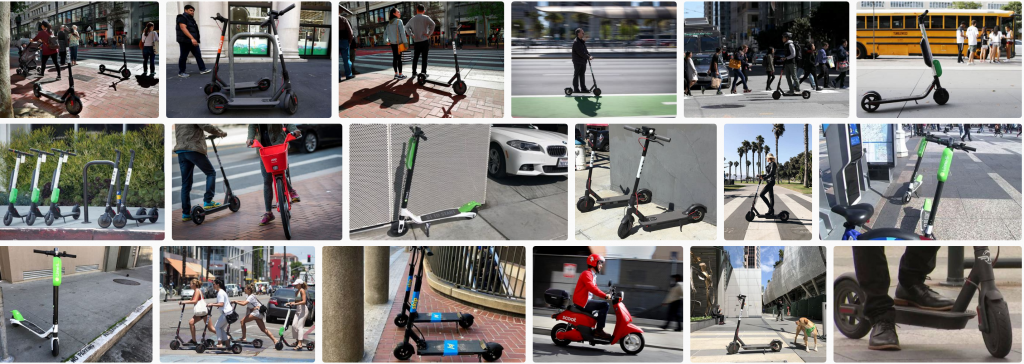
The streets of San Francisco have always been hilly, foggy and ideal for movie car chases — now they’re a battleground for alternative forms of transportation.

Scooters. Electric bikes. Hoverboards. Just who gets to use the bike lane? Park on the sidewalk? Take up streets for docking stations? Going by recent headlines, it’s a skirmish, conflict and a battle.

Mapbox recently hosted a crack panel on micro-mobility. In addition to stuffing myself with dumplings and potstickers (so, so grateful not to stare down the standard soggy meetup takeout pizza!) here are a couple of quick takeaways: Continue reading

Maps at your fingertips: The challenges and future of tactile maps

This isn’t the first time Frank Welte finds himself in front of an audience that doesn’t know how to read a map. He stands up and presses the thick 11” X 11.5 paper map across his torso on a diagonal. The right hand holds one corner steady; with the left he navigates a slice of San Francisco’s South of Market neighborhood.

“The first thing I’ll do,” he tells the assembled graphic designers, user experience experts and urban planners during a two-hour workshop, “is start at the upper left, to see what the title of the map is, find the scale and locate north.” This three-page black and white map shows the area around Market Street where Welte, who is blind, works as an accessibility media specialist at LightHouse for the Blind and Visually Impaired. Without adding a crinkle to his blue dress shirt, he speeds to the center of the map for the “you are here” cluster of dots in a circle, finds Market street and starts tracing parallel streets, using the key on the pages behind it to locate street names.

Frank Welte critiques a tactile campus map.

Continue reading

Building resiliency maps for Indonesia

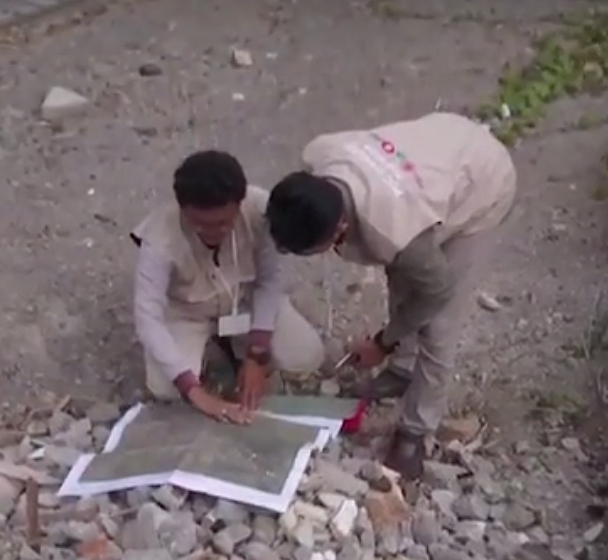
Mappers in Semarang. Via Humanitarian OpenStreetMap Team Indonesia.

Landslides. Motorcycle accidents. Mistaken for terrorists. These are some of the challenges faced by a team of local mappers in Indonesia working on disaster preparedness projects in three cities.

These speed bumps only make Harry Mahardhika chuckle. A training officer at Humanitarian OpenStreetMap Team Indonesia, he still managed to hand over atlases to government officials in Jakarta, Surabaya and Semarang. The printed maps show what he calls “lifeline infrastructure” —  shelters, reservoirs, banks, hospitals, fire stations and the like. His team also provides workshops to officials on best practices for verifying map data plus training manuals and documentation on mapmaking. Continue reading

Looking at the world through “Red Lines: Maps that recount our world”

SAN FRANCISCO — Federico Rampini wants everyone to play with maps. The veteran foreign correspondent – Brussels, Beijing, New York – has been drawing red lines on maps to reveal more about present, past and future geopolitics.

Rampini is something of a professional wanderer. Born in Genoa, Italy he grew up in Brussels. Still in his 20s, a stint at an Italian communist paper and a knack for languages landed him some reporting trips abroad. He’s been on the move ever since. Now a naturalized U.S. citizen based in New York, he returned “home” to San Francisco where he lived in the early aughts to present his latest book. Continue reading

Beautiful maps in minutes: Meet Kepler.gl

SAN FRANCISCO — Shan He may hold Silicon Valley’s most meta job.

“When I started out, I was building maps. Then I moved on to build tools to build maps and now I’m doing tools to do tools that build maps.”

He, who dumped brick-and-mortar architecture studies for computational design, joined Uber as founding member of the data visualization team in 2014. She went on to construct Kepler.gl, a tool that helps make “beautiful maps in like 10 seconds” — without any coding. Built using the deck.gl WebGL data visualization framework, the ride-sharing company recently open-sourced the geospatial toolbox that can be used with QGIS, Carto and Mapbox Studio. Given its origins, it’s easy to see why Kepler excels at large-scale visualizations centering on geolocations.

She set the stage for a recent standing-room-only meetup hosted by Mapbox for two case studies on what the tool can do and how you can get involved.

Catching air inside Uber

Chris Gervang, software engineer at Uber, started playing around with Kepler.gl without alerting his data vis team colleagues to his tinkering. Gervang works on one of the Valley’s most (ahem) pie-in-the-sky initiatives: an urban air transportation project dubbed Elevate. The second Uber Elevate summit featured a keynote by the head of aviation, Eric Allison, that would’ve fallen flat if not bolstered with stunning maps.

Titled “Scaling Uber Air,” it featured data visualizations to show everything the company knows about how people move around in cities and how to use that to model the future Uber air network.
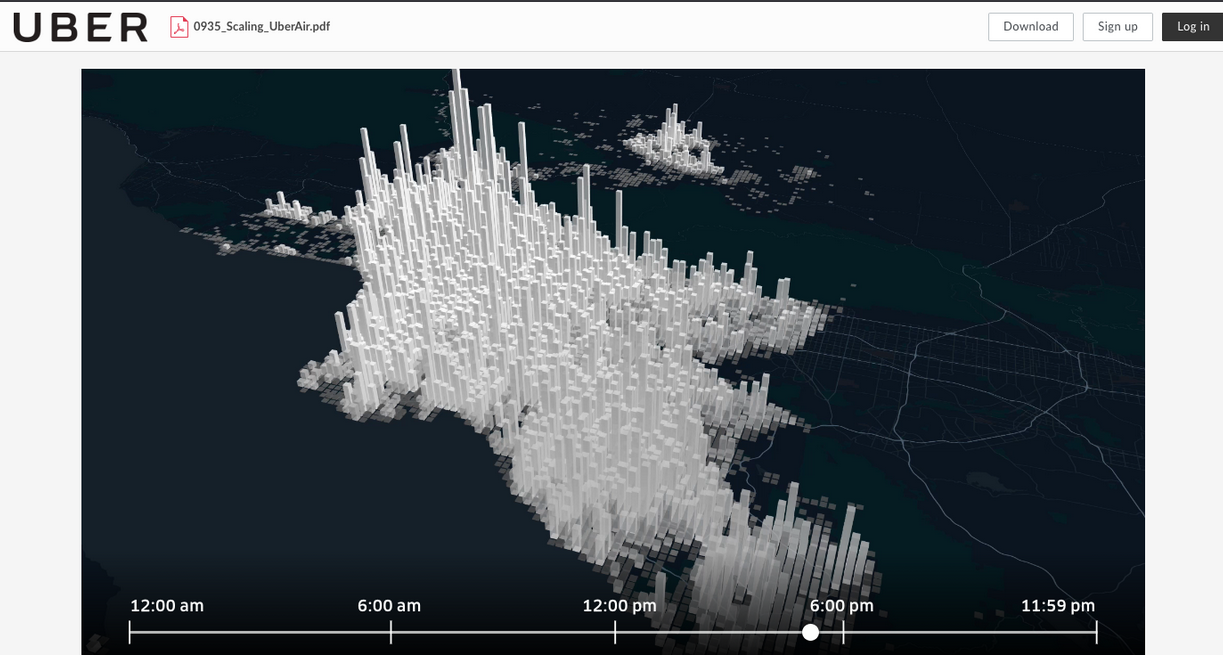
“We were extremely careful to use realistic data for our visualizations, to show what we think Uber Air can look like using our most current research,” Gervang says.

To produce the visuals, they used images captured from a cinematography app, on top of Kepler.gl. in a four-step process: planning the story, using Kepler.gl to visualize the data in motion, then a video editor to add effects that weren’t available in a browser and, finally, put them into a slide deck to add graphics. His team then repeated the process for all 17 visualizations in the keynote.

One of those maps showed an average weekday in Los Angeles and Orange counties, 45.8 million unique trips happen over a 24-hour period aggregated, into one kilometer by one kilometer tiles — here’s that bit from the keynote, it’s even more impressive with motion. The entire keynote or slides are also available.

Lime time

If Uber is hated enough to regularly station guards outside its Market Street headquarters, Lime has the distinction of being one of three scooter sharing companies recently booted from the streets of San Francisco.

Aash Anand, head of analytics at Lime, says the company started out in 2017 in a much less contentious space, just a “normal, not electric, bike sharing startup.” One of the visuals showed a Kepler-made map of bike patterns spidering around Greensboro, North Carolina, the first Lime town.

Anand says that speed is what gives Kepler an edge — he put together his presentation for the meetup together on the 40-minute Uber ride from Lime’s San Mateo headquarters.
“That’s actually the biggest value of Kepler has added to my life as someone who works with data,” he says. “When Lime started really growing there was no time to make things look pretty and perfect, some of these were done at lightning speed, at the request of someone in a crisis.”

What’s next

The team at Uber hopes mapmakers that will adopt Kepler — and provide feedback. As they’re planning out the next set of features —including making sharing a lot easier more visualization types, especially “cool things like flight paths” Shan He says— they are asking folks to take a survey and hashtag any projects with #keplergl. If you’re ready to try it out, try the demo or check out the GitHub repository and the tutorials on Vis Academy, a hub for visualization tutorials and classes prepared by the Uber Visualization team.
Spot the difference: The new Apple maps

As a kid, I had a total thing for those “spot the difference” cartoons.

Here’s a look at what I found with the new Apple Maps for San Francisco, want to play* along?

(*Every attempt was made to frame maps at same zoom level but no scientific-y methods were employed to do this.)

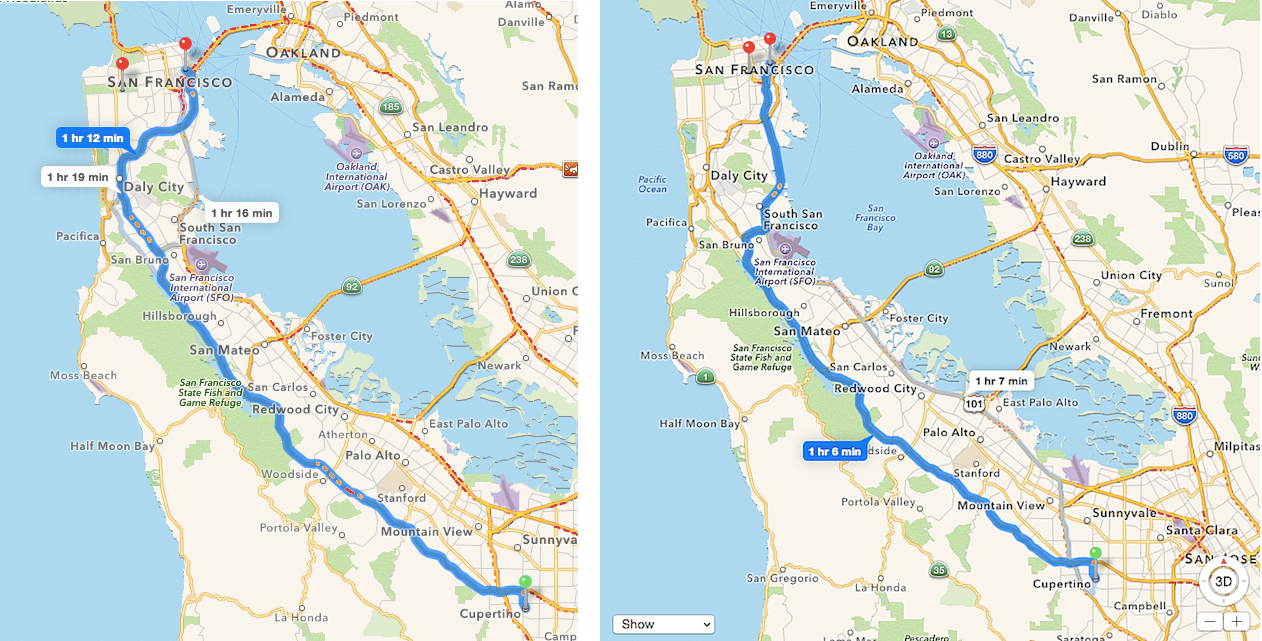
Driving directions from Cupertino to San Francisco

Click to expand. Old version on the left. In the new version the option to show traffic and 3D are always in frame.

Continue reading

Stories, Stats & Scatterplots: Inside data visualization at the Financial Times

Four years ago, John Burn-Murdoch was a journalist who had never written a line of code. These days, the senior data visualization journalist at the Financial Times says he rarely writes anything but code.

While what Burn-Murdoch dubs a “cool journey” sounds a little extreme (from zero to R, on the job, seriously?), he was never strictly a text journalist. He holds advanced degrees in data science and interactive journalism. Before landing at the FT, he worked as data journalist at The Guardian for two years.

On loan from the London headquarters to focus on bias in artificial intelligence and geographical inequality, the spiky-haired, elfin Burn-Murdoch offered a peek inside the workings of the FT data newsroom for about 50 members of the Bay Area d3 User Group.

Continue reading

Adventures in data cleaning: Did the New York Times undercount risky San Francisco skyscrapers?

It looks like the New York Times may have undercounted the number of risky skyscrapers in downtown San Francisco, 48 instead of 39. It’s a seemingly small difference – 20 percent if you do the math – but it’s significant if you consider how many people work in these large buildings. A June 15 story focused on steel moment buildings cited in a USGS report.

I made a quick map using the addresses from the NYT story, then I wanted to make one that included photos of the buildings. This time I went directly to the report, noticing that the first address wasn’t listed in the story, it seemed like a good idea to see if there were any more discrepancies.

TL;DR

To check how I got them:

  • The USGS report, starting on page 360, in .PDF
  • The .KML file I made, for more fact-checking and map making (pretty please send links to your maps or put them in the comments – I’m a casual mapper, using new tools and working quickly!)
  • Here are the additional nine addresses from the report that weren’t in the NYT story:
  1. The Mills Building, 221 Montgomery Street
  2. 225 Bush Street
  3. 140 Montgomery Street
  4. 120 Montgomery Street
  5. 45 Fremont Street
  6. 55 2nd Street
  7. 555 Mission Street
  8. 611 Folsom Street
  9. 680 Folsom Street

The clumsy adventure

To start, I downloaded the 454-page .PDF, then extracted five pages with the buildings listed by using the >Print>Pages>Save as .PDF function in Preview for Mac. Then I converted the .PDF to .CSV with Sejda. After that, it was time for Terminal to merge the extracted data from those pages into one file with the command:

cat *.csv >merged.csv

Still too messy to be useful without a lot of tedious cleanup:

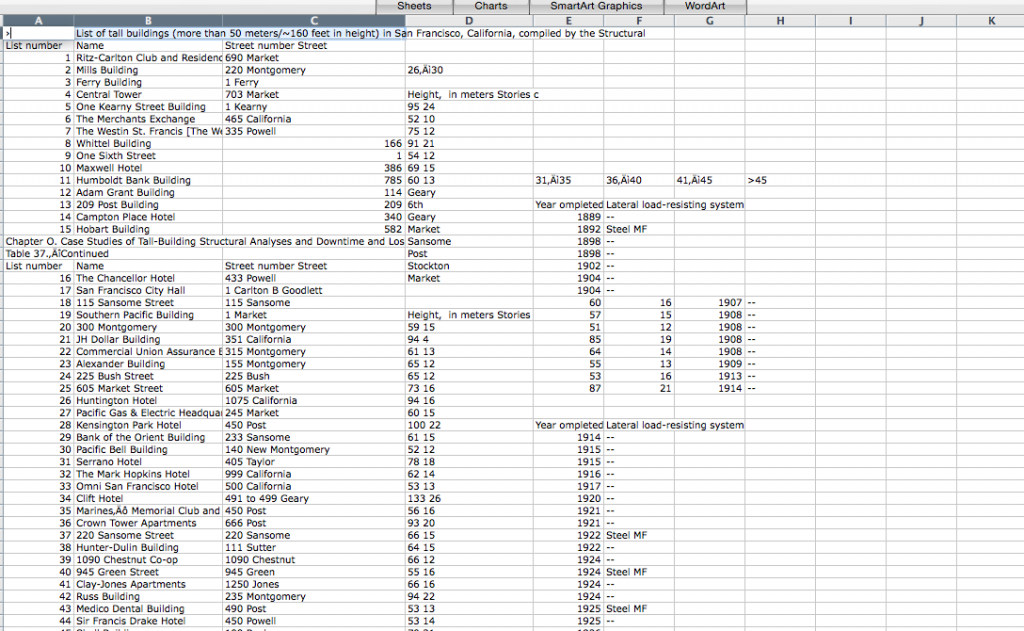
So I tried the quickest and dirtiest way I know: copy the table from the .PDF into Word, then from Word (where it’s recognized as a table) copy it into Excel.

There are a couple hundred buildings listed, but the ones cited in the story are steel moment frames. Erected before a 1994 building code outlawed a flawed welding technique, they harbor particular risk in a quake of magnitude seven or higher.

From the USGS report: Steel moment frame listed as “Steel MF,” “Steel moment frame” and “MF.”

From there it was a question of sorting the buildings listed as “Steel MF,” noting that a couple are listed alternatively as “Steel moment frame” and one as simply as “MF.” Messy messy messy: also, totally typical. (There were also about 15 more listed as Steel MF in combination with some other reinforcement, since it would require more reporting to figure out if they’re as risky, these were left out.)

Then I checked the addresses against the story, added polygons for the nine new addresses to the previous uMap, downloaded it as a .KML file and started playing around in Google Maps.

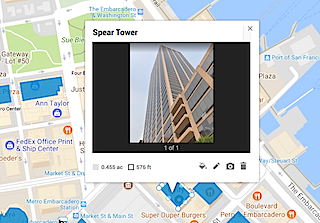
The resulting map is a little disappointing. For starters, the polygons from uMap (which uses OpenStreetMap) don’t jibe that well with Google. As for the images – since the real a-ha if you live or work in San Francisco is how many of these buildings you’re in or around – I always forget how bad these are in the noob version of Google Maps. When you’re editing in the map, they are Polaroid-style pop-ups that resize whatever pic you throw in. The published version looks nothing like that and the overall effect with these building shots (all vertical) is horrific. Ugh. There’s no way to resize the window from this version of Google Maps – the alternatives are Google Fusion tables (which wouldn’t solve the problem here since AFAIK it works with points, not polygons) or  programming via the Google Maps API.

Why this happened

So how did the New York Times undercount the number of especially shaky high rises? Going on my experience with newsrooms (long) and with data (short but painful) my first guess is that the USGS mistakenly gave the Times an Excel or .CSV file that was different from what ended up in the final report.

The reporter knew there were enough buildings to warrant a story, somewhere around 40, the graphics person had the file, made the map and those numbers were plugged into the story and fact checked without going back to the published report.

Or there was some glitch between the formats – given how annoying the process of getting information from .PDF into anything – it’s easy enough. Data cleaning is the least interesting, most tedious part of any project. In this case, if I’m right, there are 20 percent more risky buildings than originally reported.

A quickie map of San Francisco’s earthquake prone skyscrapers


See full screen

See full screen – search for San Francisco if you see a world map.

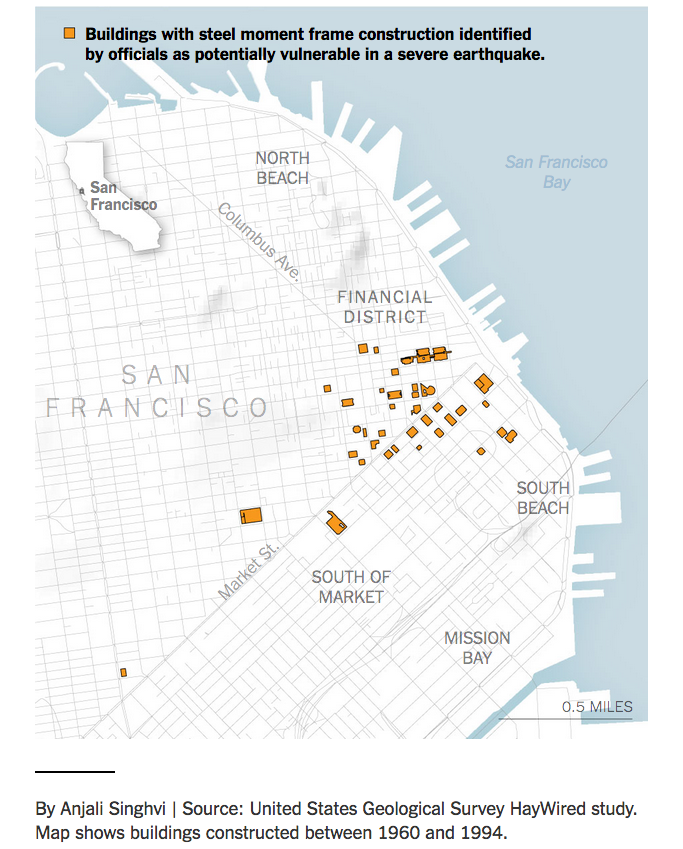
The New York Times recently ran a story about San Francisco high rises – mostly downtown and South of Market – with steel frames that harbor particular risk in a quake of magnitude seven or higher. About 40 of these skyscrapers, erected before a 1994 building code outlawed a flawed welding technique, were cited in an April USGS report.

It’s one of those stories that could’ve used in interactive map at its core, but instead (it’s the news business, kid!) the map was a small, static graphic (see below) and the story ended with a list of the addresses.

Image courtesy NYT.

So here’s a simple map of those 39 steel moment-frame buildings. A few necessary caveats: this is the handiwork of a casual mapper trying out a new tool. I’ve been looking for a way to use OpenStreetMap to make personalized maps and spotted some earthquake maps from the Japanese OSM community with uMap, so it seemed worth a try. It was heavy going for a map made on the fly – the polygon tool was clunky and importing the list as a cleaned up .CSV wasn’t happening.

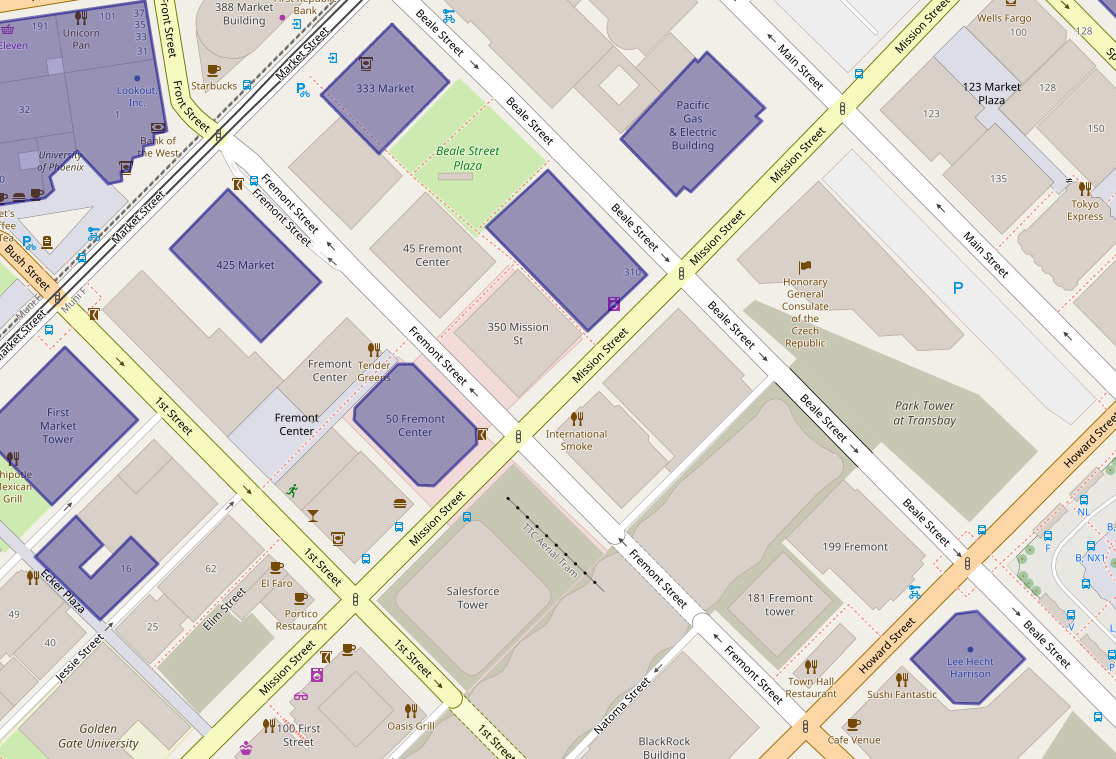
Still, a few things pop out: A few of these risky buildings are also near construction sites. In OSM, these are shown in sage green. (The light green represents parks.)

The struggle to use the uMap polygon tool is real. This is a closeup of 550 California Street, with a 19-story office building under construction nearby.

The Folsom Bay Tower will be a 39-story, 422-foot (129 m) residential skyscraper.

Park Tower at Transbay will have 43 stories, First & Mission’s Oceanwide Center features 636-foot-tall tower on Mission at First Street and a 910-foot-tall tower on the opposite corner on First Street.

And much like the reporter, shocked to discover the NYT offices are in one of these buildings, there were a few a-ha moments. A family member works in one and I’ve been inside at least a handful recently – an event at Autodesk, a movie at Embarcadero Center, a meetup, drinks with a friend staying at the Marriott, emerged from the Montgomery Street Station in front of one three or four times, etc.

It’s an unscientific sample size of one (well, two if you count the reporter) but would wager that most people who live or work in San Francisco are around, if not inside, these buildings frequently.

How to use mobile app Go Map!! to edit OpenStreetMap

Here’s a quick tutorial for the Go Map!! iPhone / iPad app (v1.5.3) created by Bryce Cogswell and available gratis in the app store.

The short video above shows how to edit in two scenarios – adding information to an entry and adding a point-of-interest. The text below is a mashup of my experience using it and the app’s help section.

Continue reading