
Mappers in Semarang. Via Humanitarian OpenStreetMap Team Indonesia.
Landslides. Motorcycle accidents. Mistaken for terrorists. These are some of the challenges faced by a team of local mappers in Indonesia working on disaster preparedness projects in three cities.
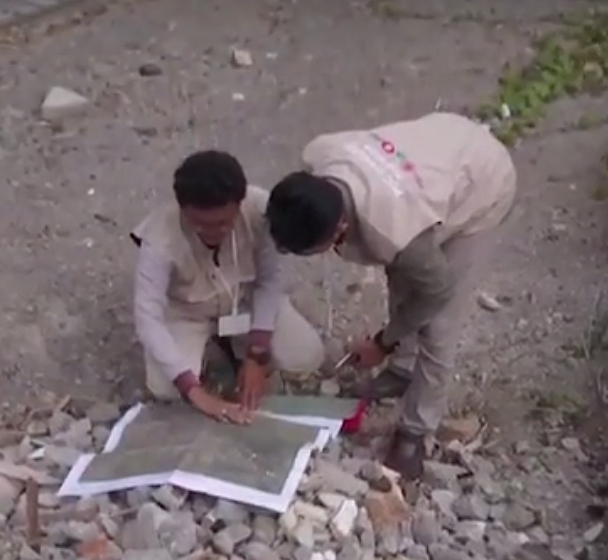
These speed bumps only make Harry Mahardhika chuckle. A training officer at Humanitarian OpenStreetMap Team Indonesia, he still managed to hand over atlases to government officials in Jakarta, Surabaya and Semarang. The printed maps show what he calls “lifeline infrastructure” — shelters, reservoirs, banks, hospitals, fire stations and the like. His team also provides workshops to officials on best practices for verifying map data plus training manuals and documentation on mapmaking.
Geography marks Indonesia for special attention. The world’s largest island country perches above the “Ring of Fire,” an arc of volcanoes and fault lines in the Pacific Basin. The consequences can be devastating: the death toll from the most recent earthquake and tsunami on Sulawesi island climbed past 2,000.
That makes this kind of resiliency mapping project even more important. “Governments need community and the community also needs government,” Mahardhika says. These mapping efforts were backed by USAID, the Office of U.S. Foreign Disaster Assistance (OFDA), Pacific Disaster Centre (PDC), the Massachusetts Institute of Technology (MIT) and the Indonesia National Disaster Management Agency. The toolkit included OpenStreetMap, Open Data Kit and OpenMapKit.
Pushing paper
In October 2016, Mahardhika and team spent three months mapping Surabaya, one of the oldest port cities in Southeast Asia with a core population of three million. The setup served as a template for mapping the other two cities. The first step? Pinpoint the right government officials and obtain permits. If you don’t, “you will be seen as bad people or terrorists if you are mapping an area without permission.” Having a permit didn’t necessarily stop questions from skeptical locals. When push came to shove, mappers were flanked by local workers from a disaster agency to quell fears and back up bona fides.
Gimme shelter
Deciding just what counts as lifeline infrastructure depends on the city. For example, in Jakarta, small places of worship were left off the survey because they usually don’t serve as emergency shelters but these same type of mosques were mapped in Semarang where they offer vital protection. “It’s important for us to know before mapping,” he says. And one more reason why building a community of local mappers is important.
“Locals have really important knowledge of the city, if we just sent people out who like mapping and OSM they’d spend most of the time lost.” Mappers, some recruited from local universities, needed only basic computer and internet know-how. A mapathon was also held to boost skills.
It takes two
In the two smaller cities, teams were made up of two mapping supervisors, four quality assurance people and 16 on data entry. That number bumped up to one extra QA person and a total of 20 on data entry duty in Jakarta. In the field teams of two worked best. The ideal pairing? A more experienced mapper paired with a newbie, often a person with more granular local knowledge. Mappers can cover a lot of ground in pairs and, should quibbles arise, can be worked out quickly. “We don’t want drama in this project,” he adds.

Jakarta before and after the mapping project via https://visualize-change.hotosm.org/
Motor city
The mapping journey covers a lot of ground. Motorcycles are a necessity in places like Jakarta where traffic can eat up to 90 minutes to cover three miles. Teams set out first with permits, plus survey maps and satellite images to meet with village representatives. These meetings also serve to update and verify boundaries on a district or neighborhood level, Mahardhika says. Once these are set, the team hits the road again to map the critical and priority points in the area.
The data collected feeds into OpenStreetMap with customized presets on the JOSM editor and uploaded to the server. Then it’s pored over to check both topology and tags before review by a supervisor. Once verified, the supervisor exports the data and a printed version, the atlas, is given back to local government. Using the data collected, the team also presented officials with two thematic maps: evacuation routes for Jakarta and hazards in Semarang.
The results? In five months mapping Jakarta, over 1.5 million buildings and 24,965 ‘lifeline’ points were mapped. In Semarang over the course of four months 482,740 buildings and 11,048 points of interest were added and in Surabaya in three months some 643,933 buildings and 4,417 points of interest were added. The HOT team also jumped in during the most recent earthquake to map the hardest-hit areas in Sulawesi. Up next, the HOT Indonesia team will continue partnering with Facebook to fill out the country’s road network.
Catch his full 30-minute presentation at the recent State of the Map Detroit conference here.
Pingback: Landslides, motorcycles and permits: Resiliency mapping in Indonesia – Resiliency Maps