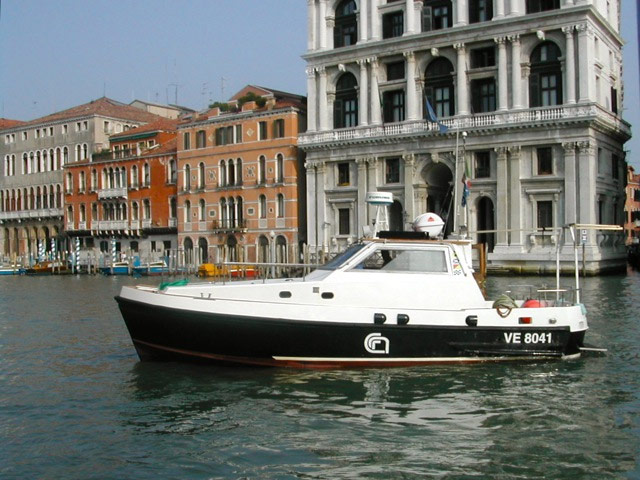
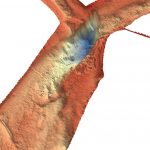
Most visitors to Venice drift through the canals on gondolas taking selfies. But a group of researchers spent seven months puttering along pointing high-resolution multibeam echosounders into the waters instead. About 30 of them in all worked aboard the powerboat Litus, intent on mapping the Venice lagoon to gauge the effects of climate change on one of the world’s most improbable cities.
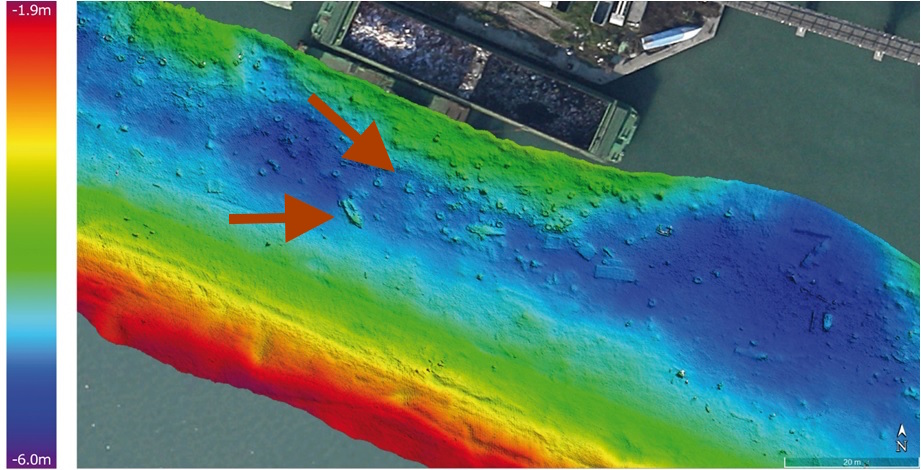
While what’s under those gray-green waters isn’t exactly surprising — boat parts, old tires and containers — scientists say the underwater elevation mapping (that’s “bathymetry,” for the technically minded) comes at a critical time.
The last 100 years have radically altered the shape and ecological makeup of the lagoon, researchers say: for starters, salt marsh areas shrunk by half and underlying sediment has radically shifted. The “floating city” already struggles to stay above water in the spring and summer floods and relative sea level rise is expected to increase their frequency. The Mose system, with its 78 mobile gates that can hold back almost 10 feet of water, construction launched in 2003 and is said to be near completion in 2018.
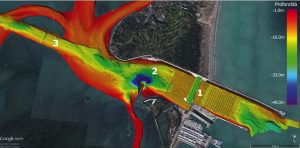
Entrance to Malamocco port 1) Mose gate 2) 48-meter (157-foot) trench 3) the oil refinery canal. Image courtesy Ismar-Cnr.
“Before the Mose system begins to function, it was important to have a full picture of the bathymetry and currents of the tidal channels and inlets, which are the most dynamic portion of the lagoon,” researchers say in a paper published in “Nature.” They caution that the relatively rapid erosive process could threaten the stability of the “hard structures” (read: priceless palazzos) in the near future and should certainly be periodically monitored.
If you want to dig into the datasets, the scientists from research groups (Ismar-Cnr and Iim) have CC-licensed and made them available online with the paper.
“The data also allows us to identify areas with large dunes at the bottom and adjacent erosion sites that document the most dynamic points in the deep lagoon, where it’s important to cyclically repeat these studies to quantify the movement of sediments,” head of the study Fantina Madricardo says in the press release (translation mine.)
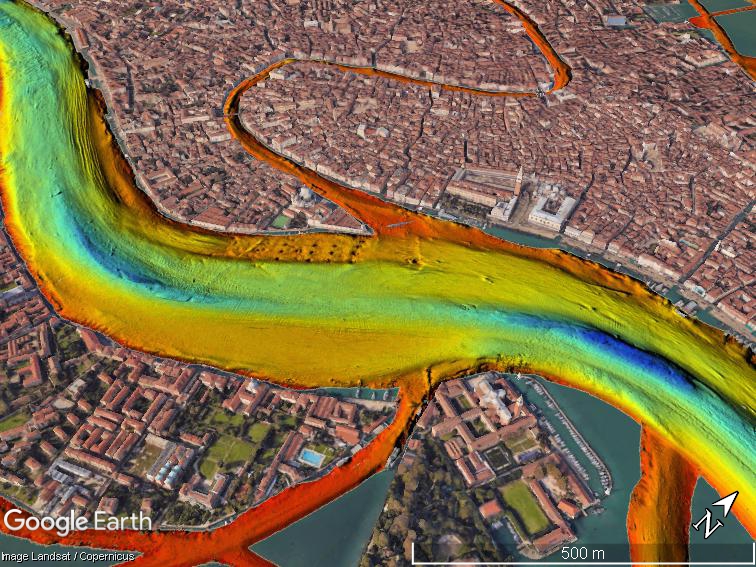
Part of the reason these Venice maps look so trippy (or alarming?) is due to the city’s curious geography, perching atop 118 islands bridged by canals. On most bathymetric maps, deeper waters are represented by soothing darker shades (green, blue, violet) and warmer colors (red, orange, yellow) represent shallower waters. A bathymetric map of the San Francisco Bay by comparison looks, well, a lot more soothing despite its notorious currents.
