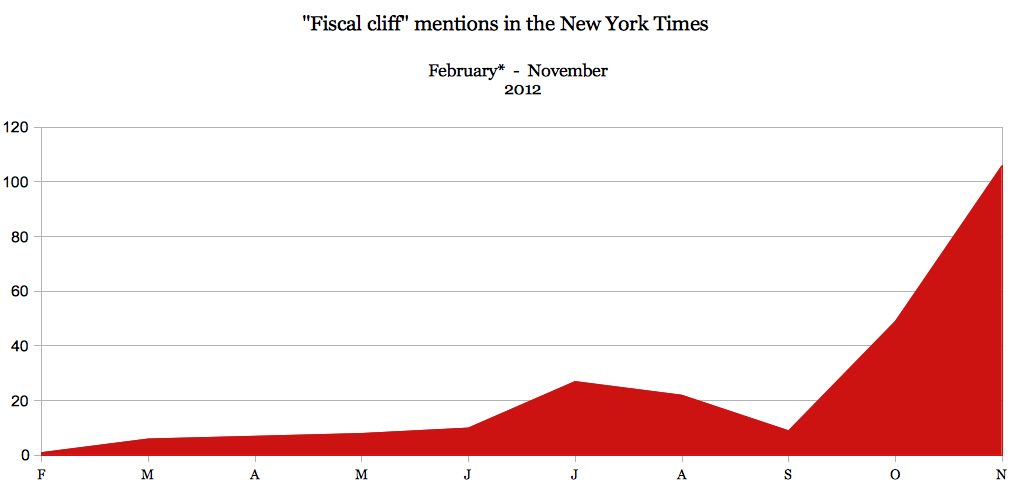
 As time goes by, it looks like we’re all going to fall off the fiscal cliff.
When thinking about ideas to test out the New York Times API, which lets you dig into everything from campaign finance to geographic tags in the old gray lady’s formidable database, I wanted to keep it simple. (The learning curve was already steep for me, to be honest.)
The chart is my first pass at using the NYT API, based in part on Jer Thorp’s chapter about it in “Beautiful Visualization,” which you can find at Amazon or a public library.
The result is a simple cliff graphic that mimics the momentum the term gained along with the budget crisis. Wikipedia dates the term “fiscal cliff” to 2011, but Federal reserve chairman Ben Bernanke gave it heft in February 2012 with testimony before the House Committee on Financial Services, the first mention is here: nyti.ms/Tcd7Lq

